


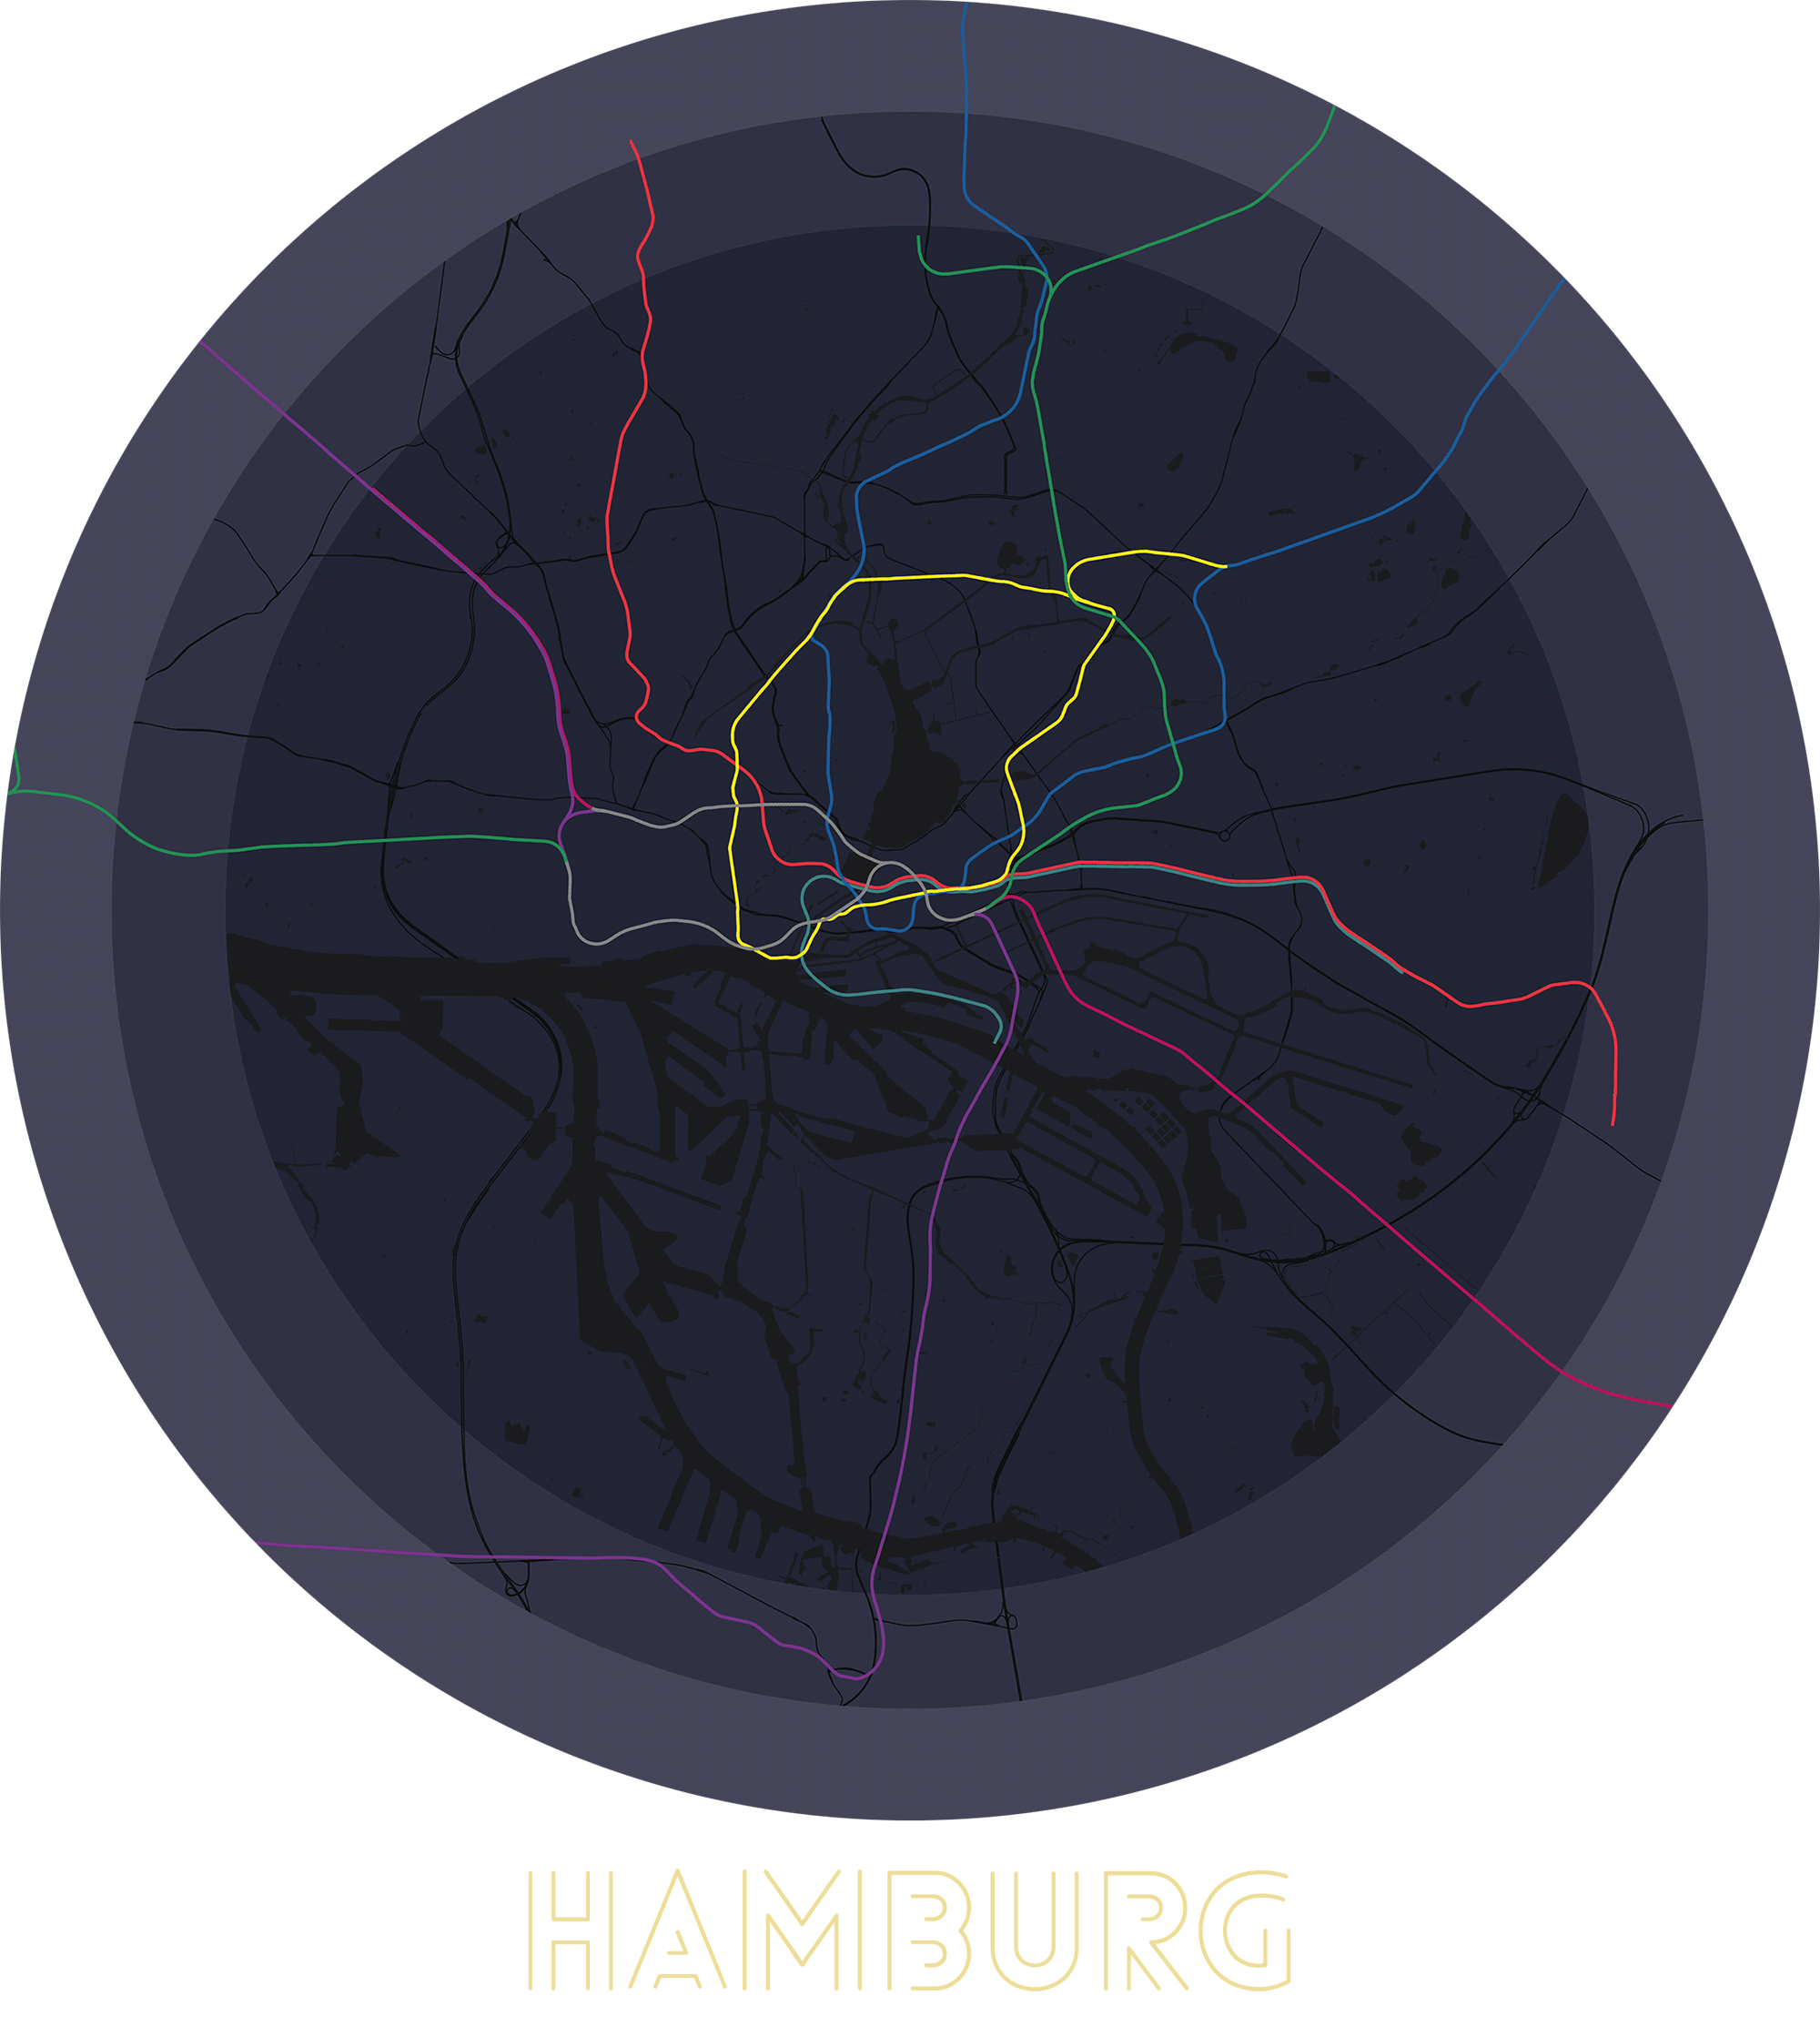
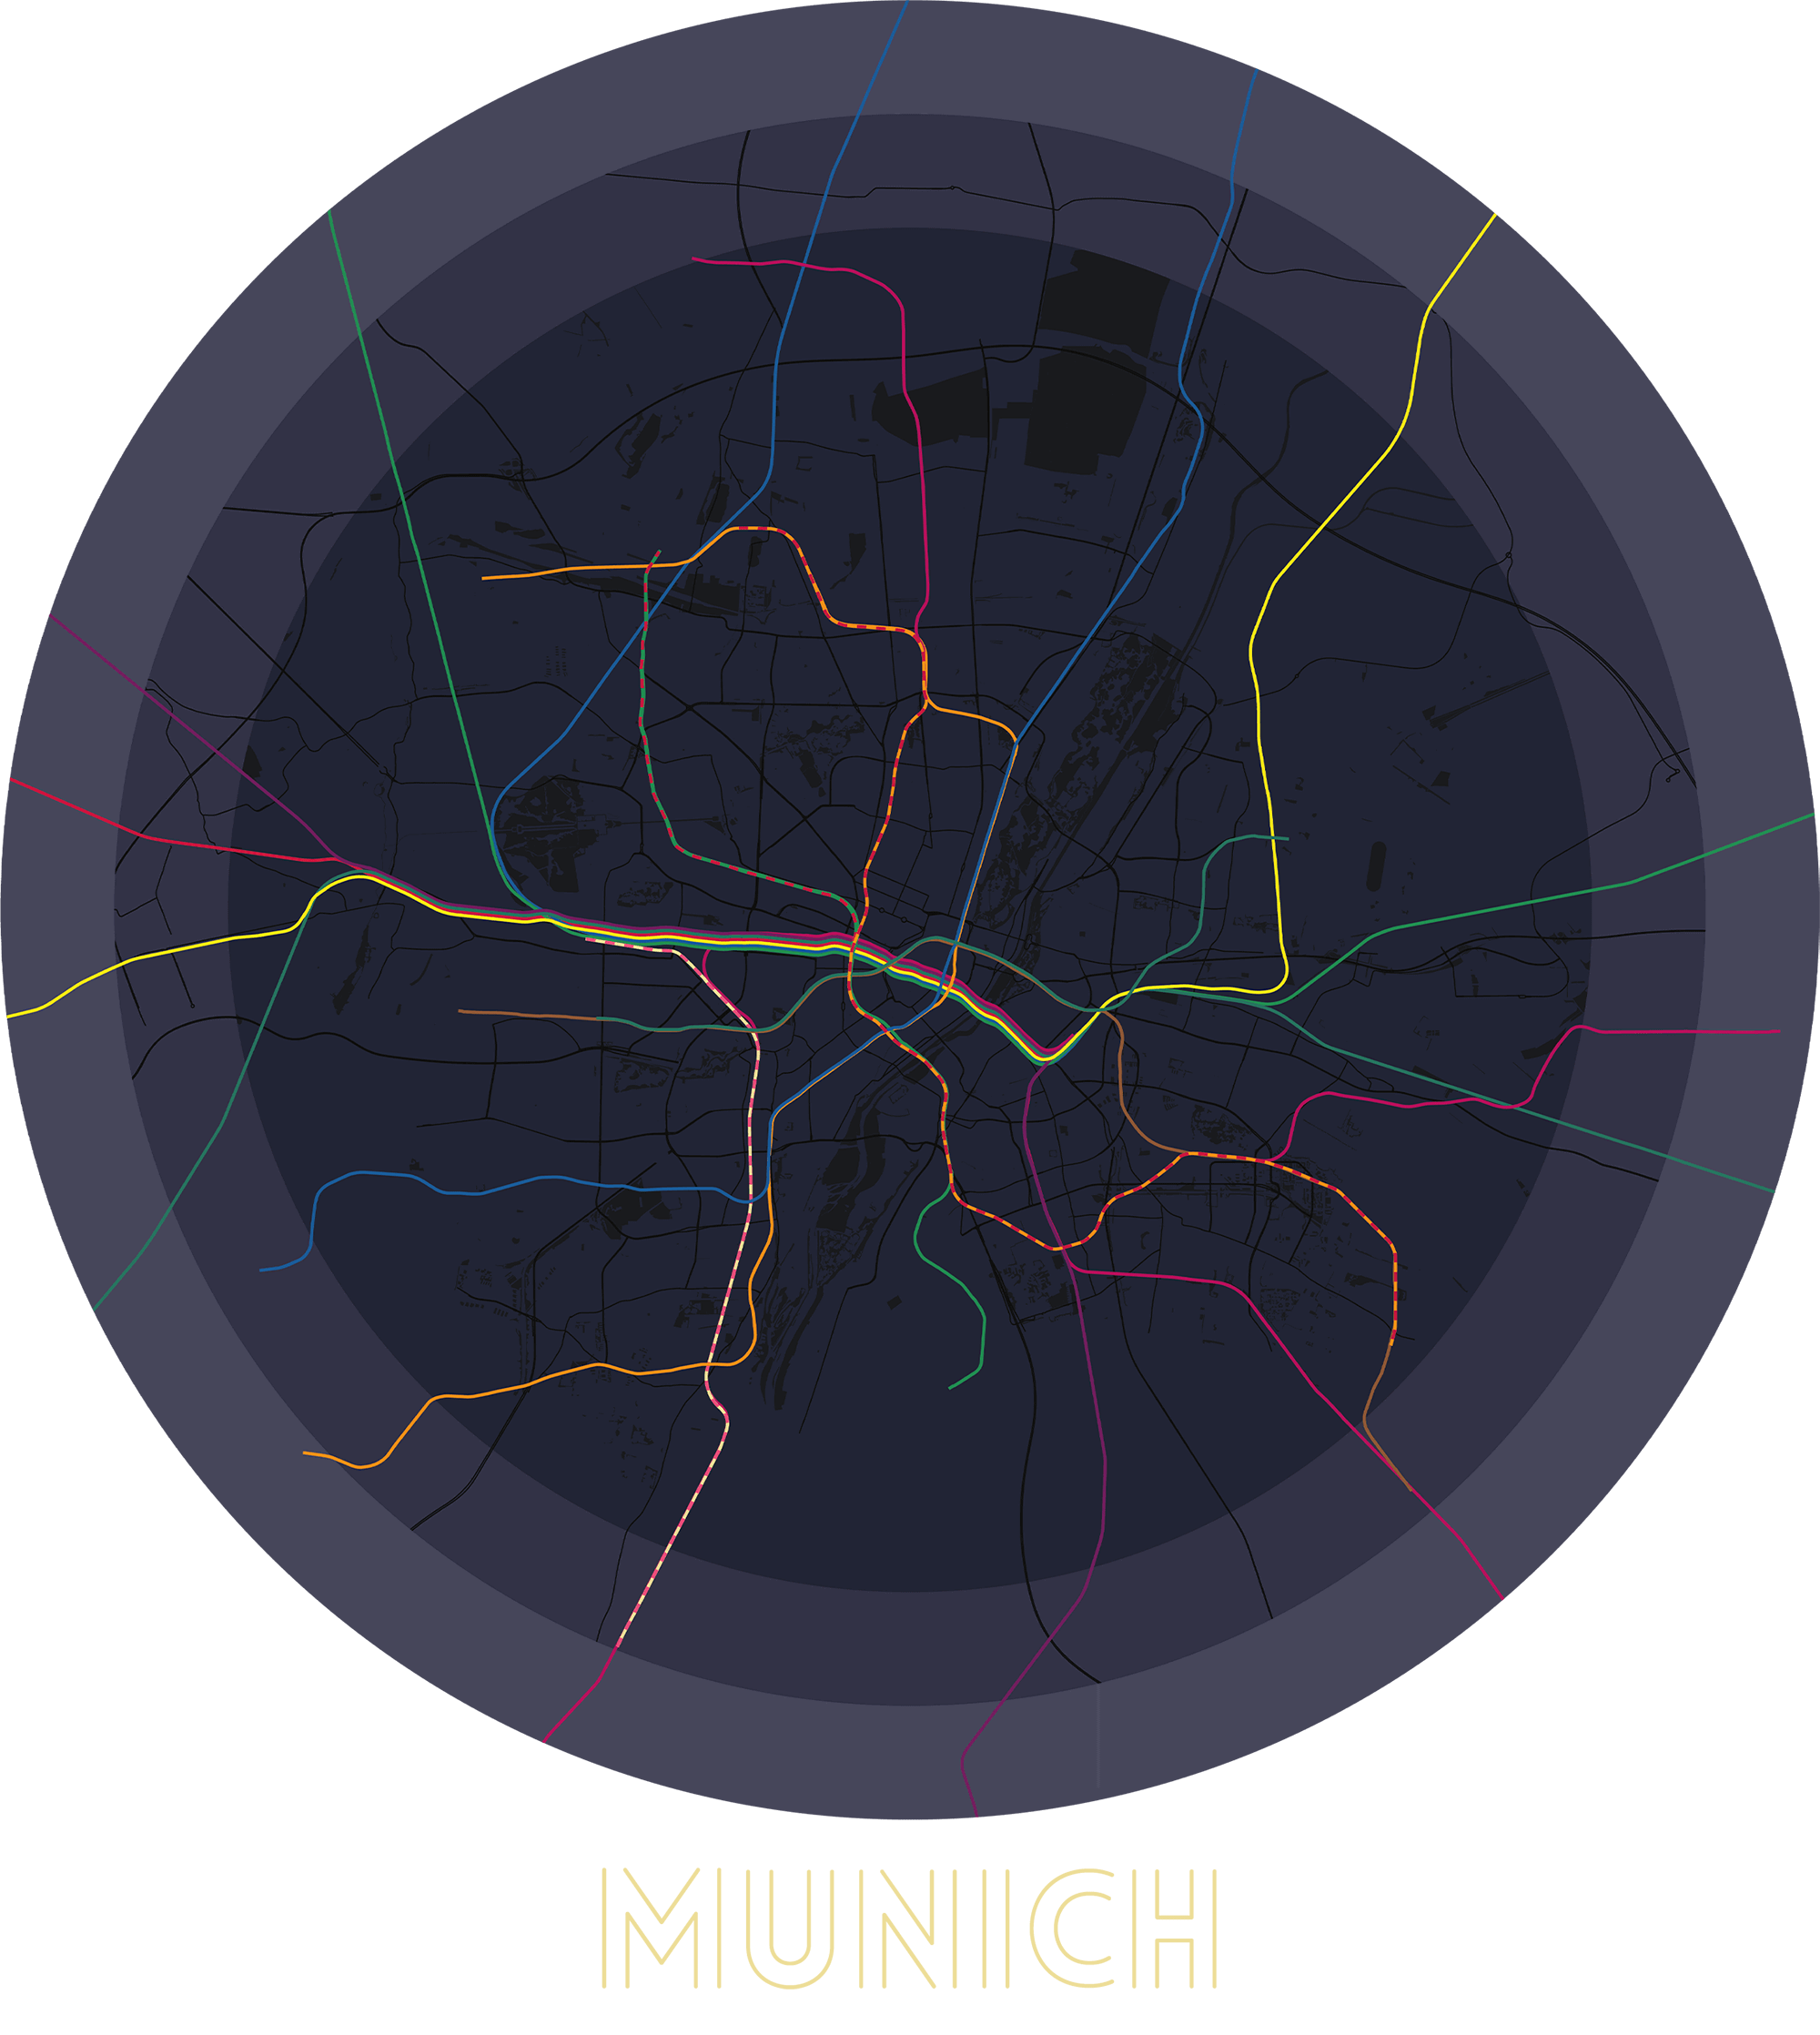
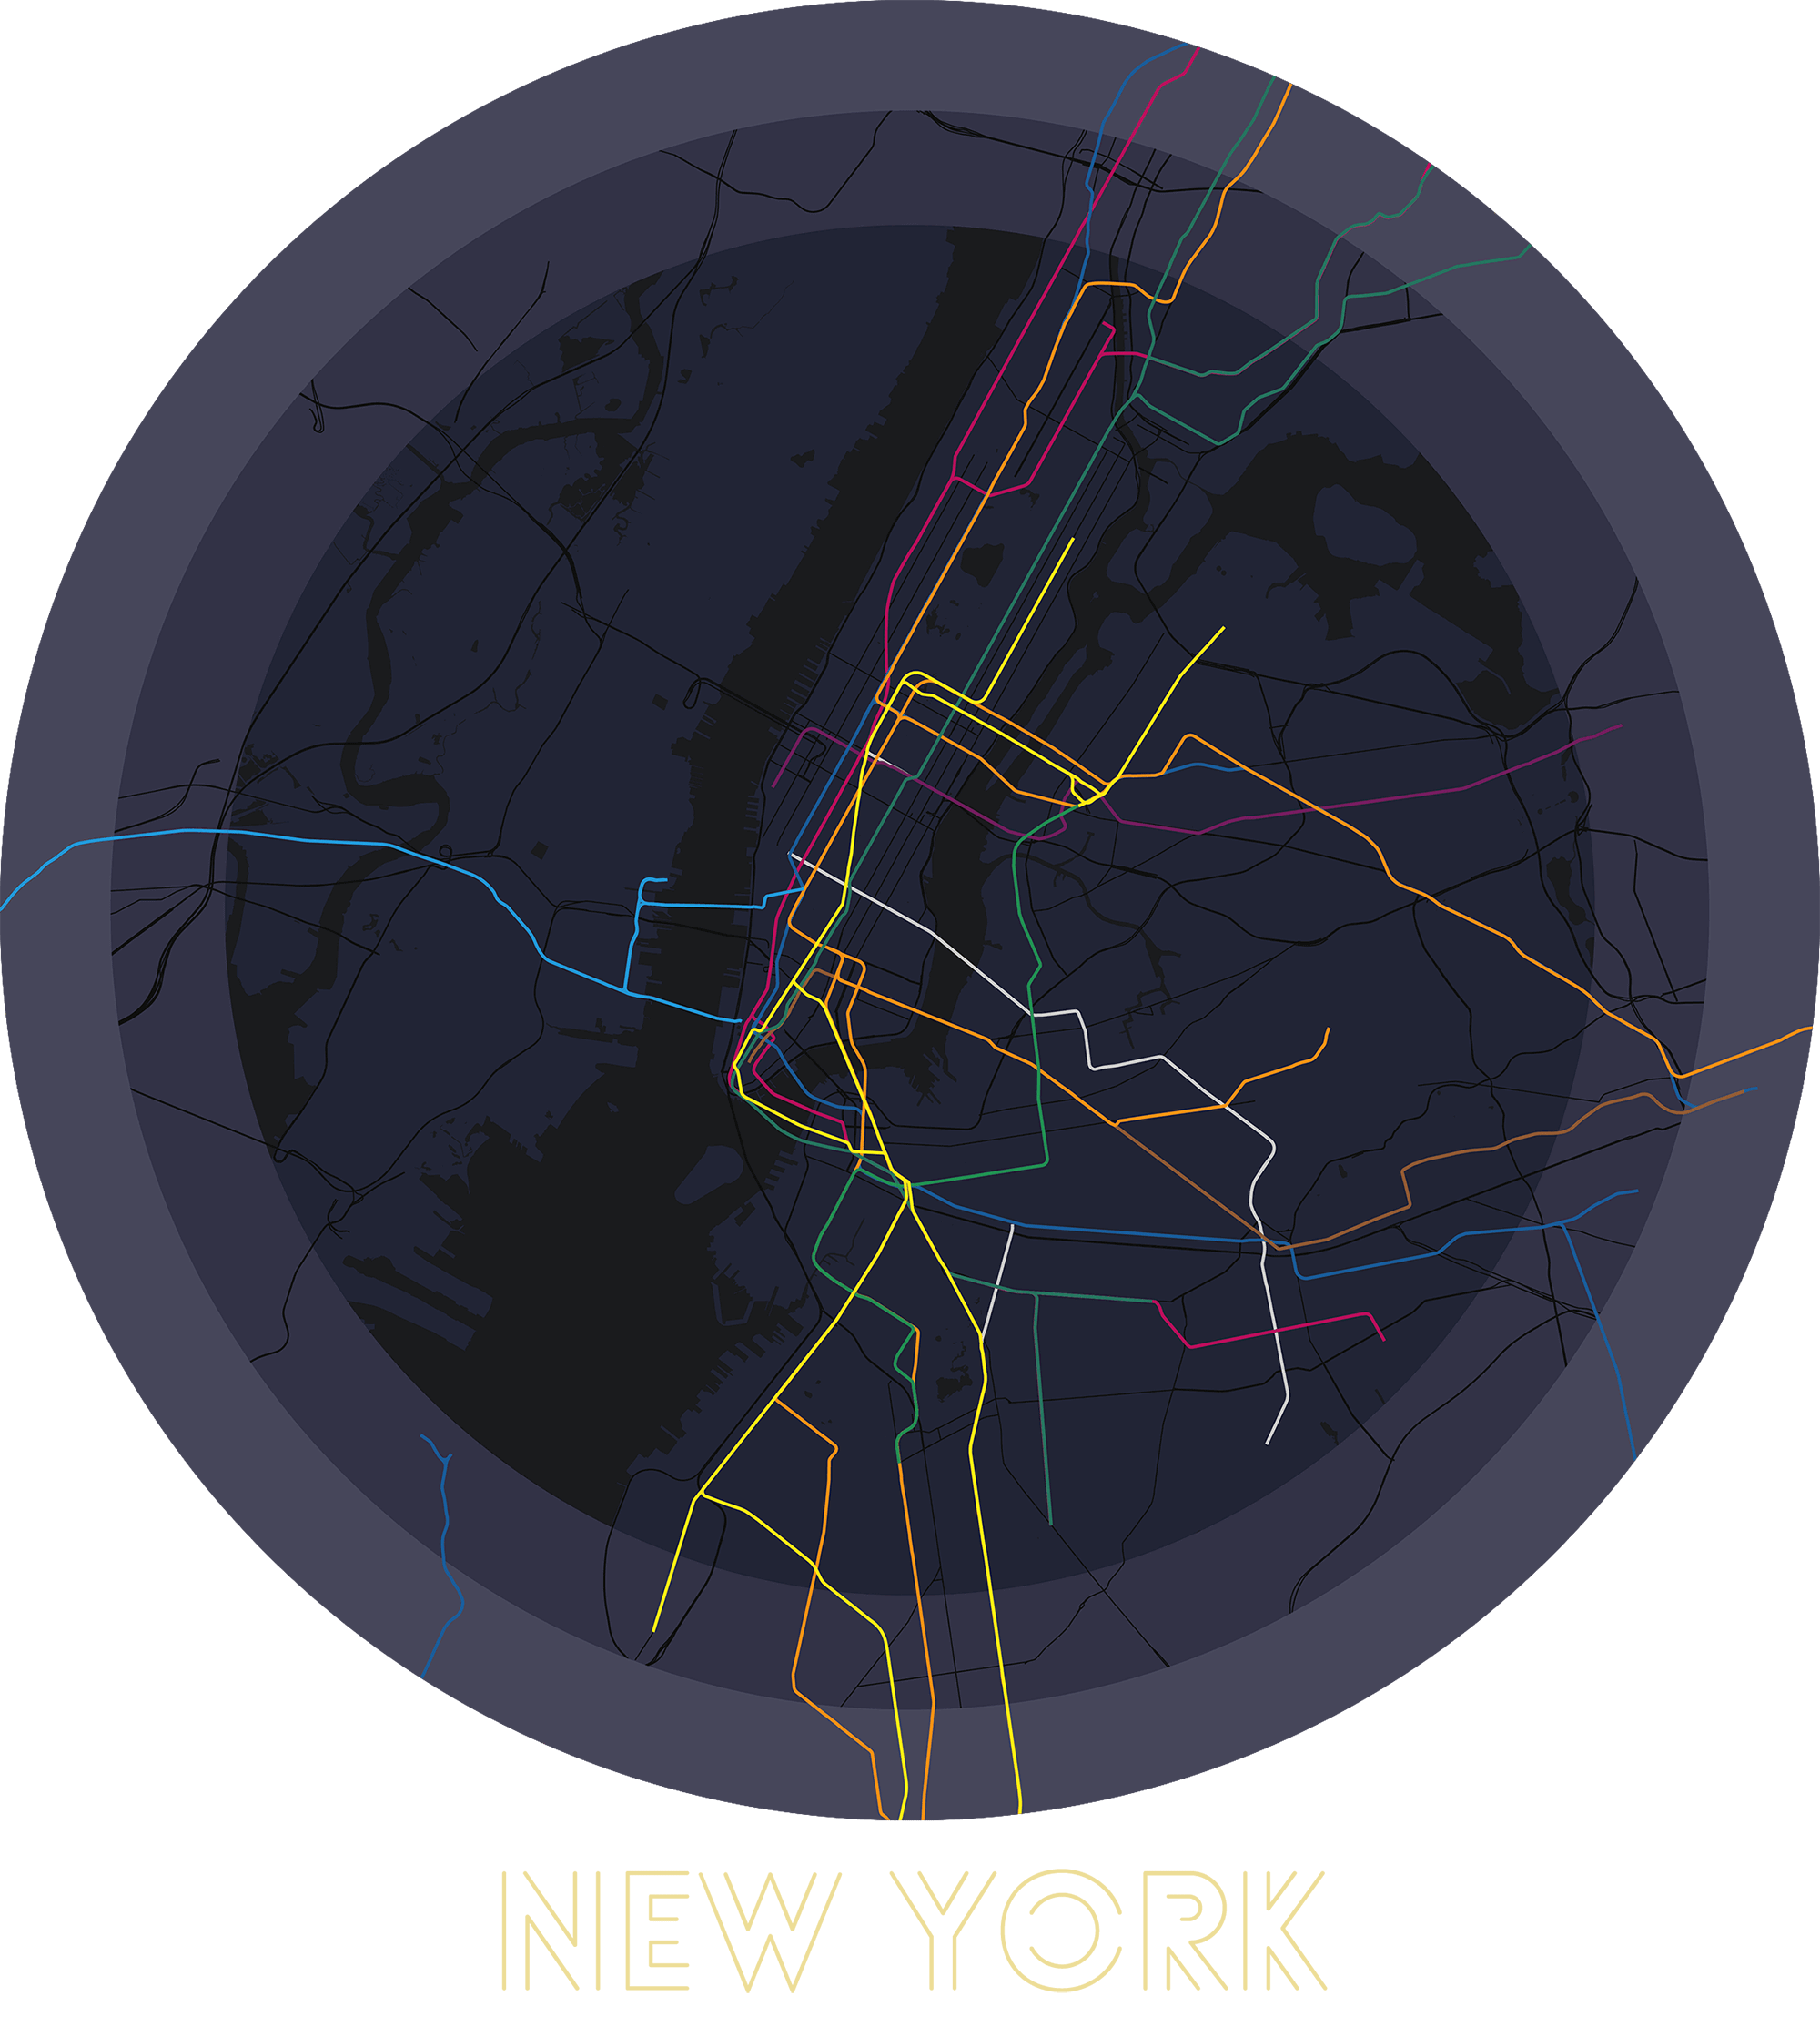
Creating Logos out of infrastructure and water landmarks. Created by exporting layers from QGIS and styling them in Adobe Illustrator. This is an ongoing project.
This map covers all cities in Germany I have ever been to. It might miss some cities which I don't remember (or was too young to know about). It is obviously a work in progress.
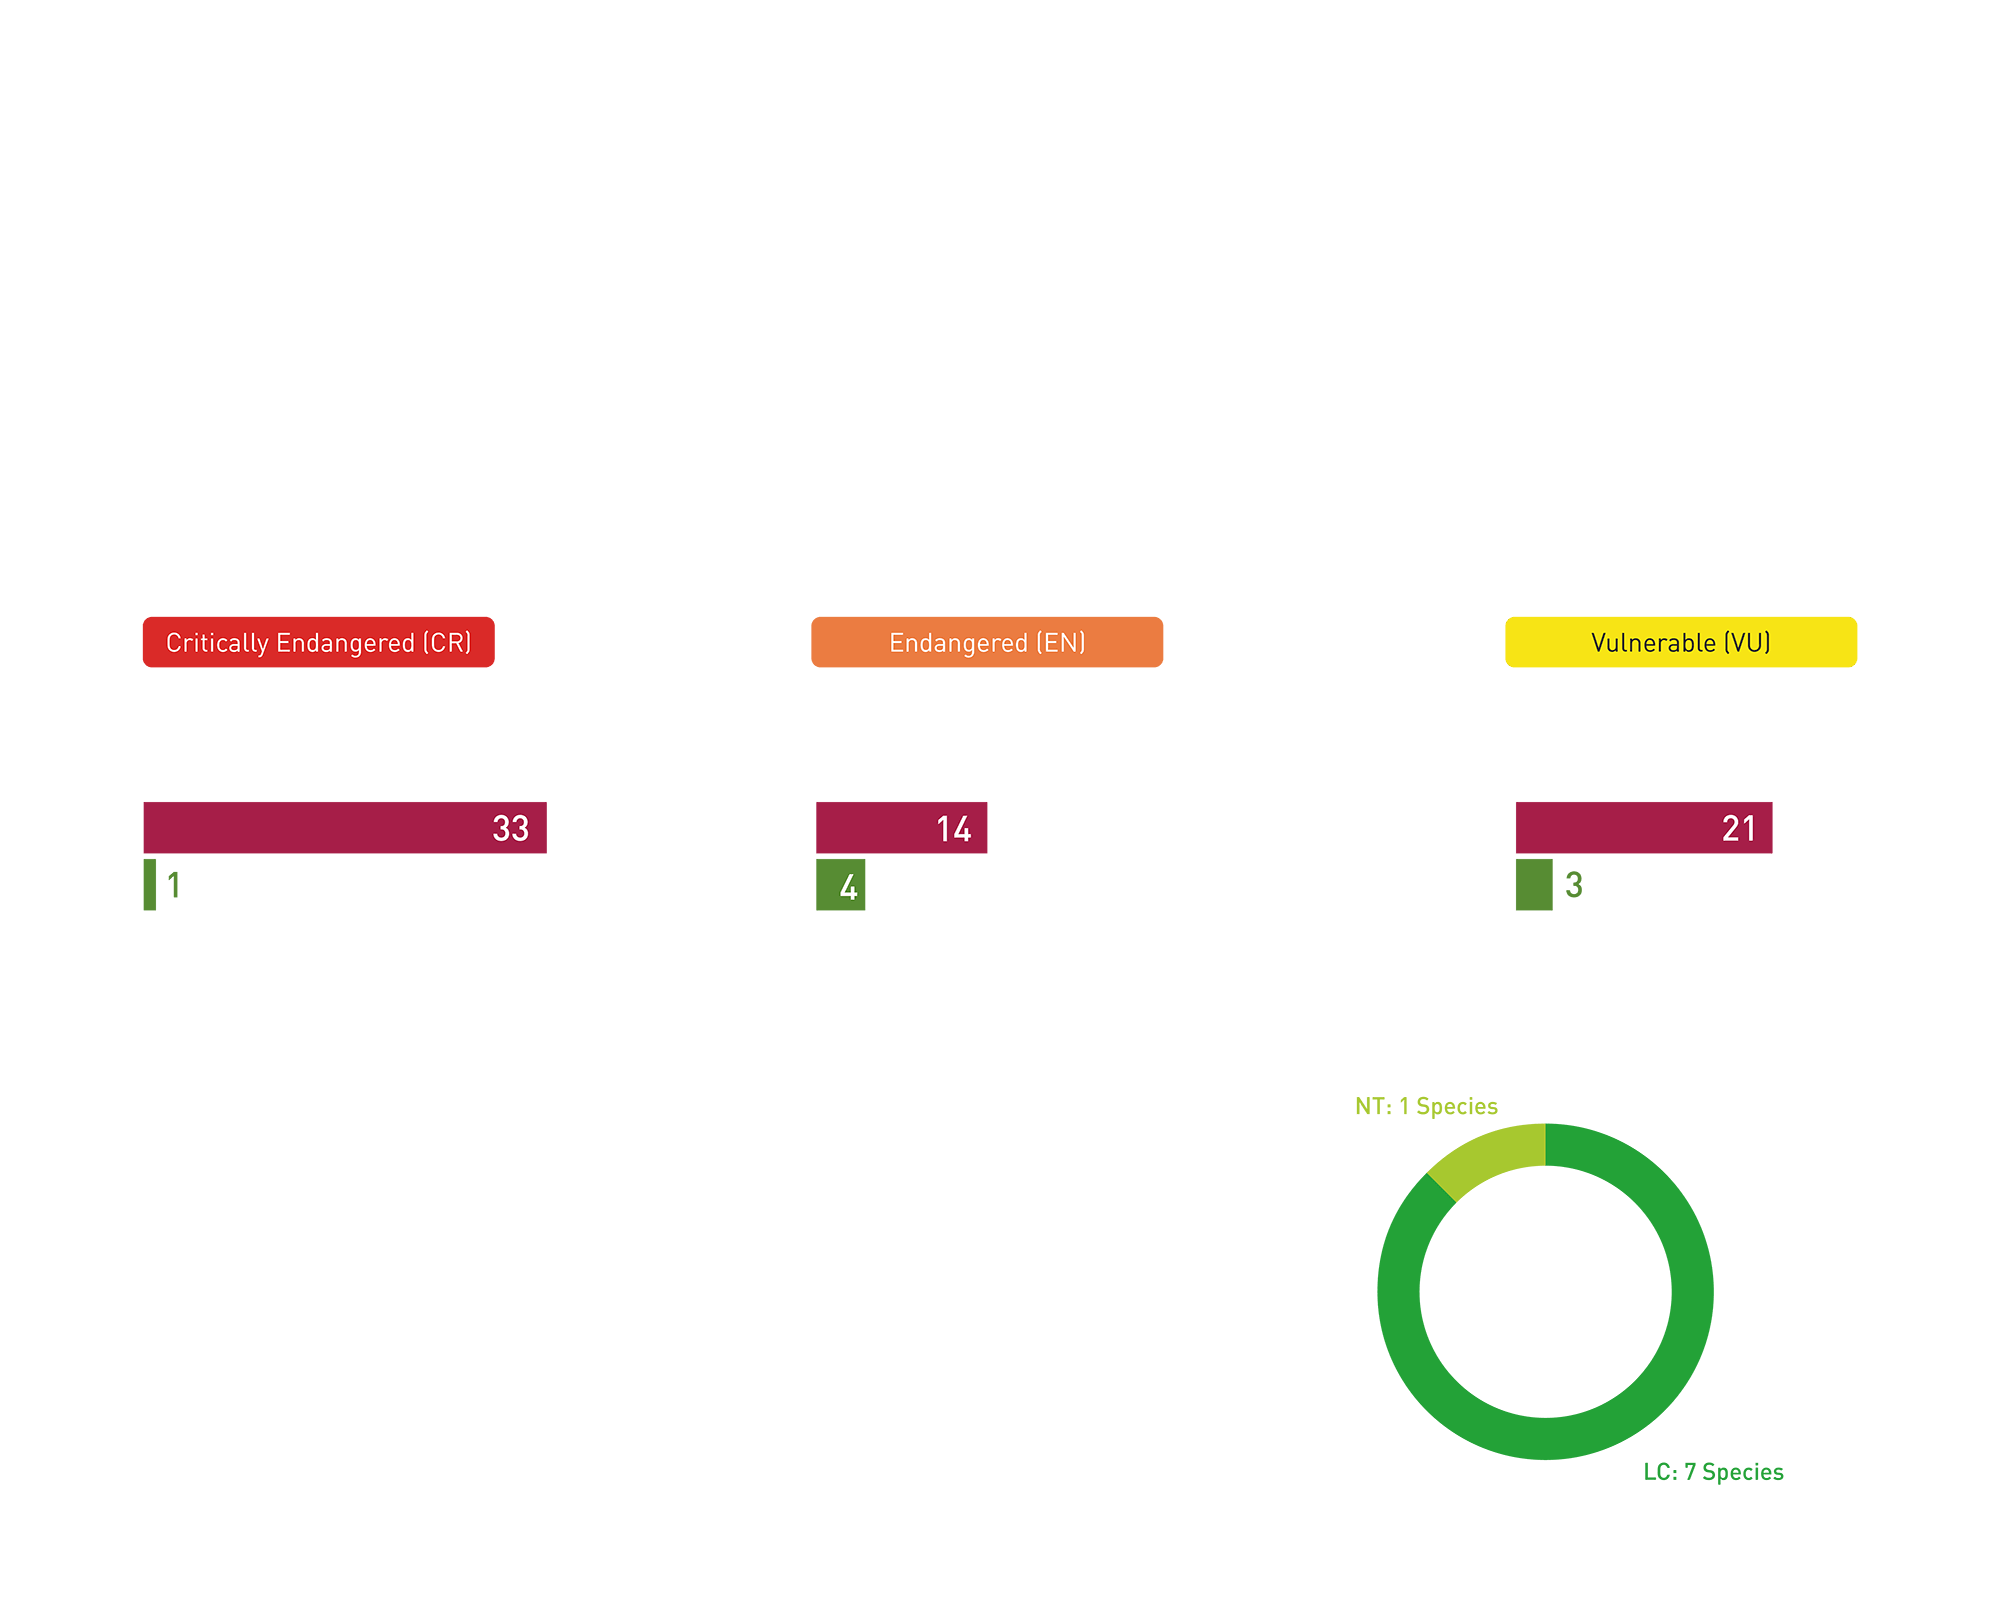
These graphs show some research regarding endangered Birds in Germany and their relation to an alleged endangerment through feral cats. It is created in Adobe Illustrator.

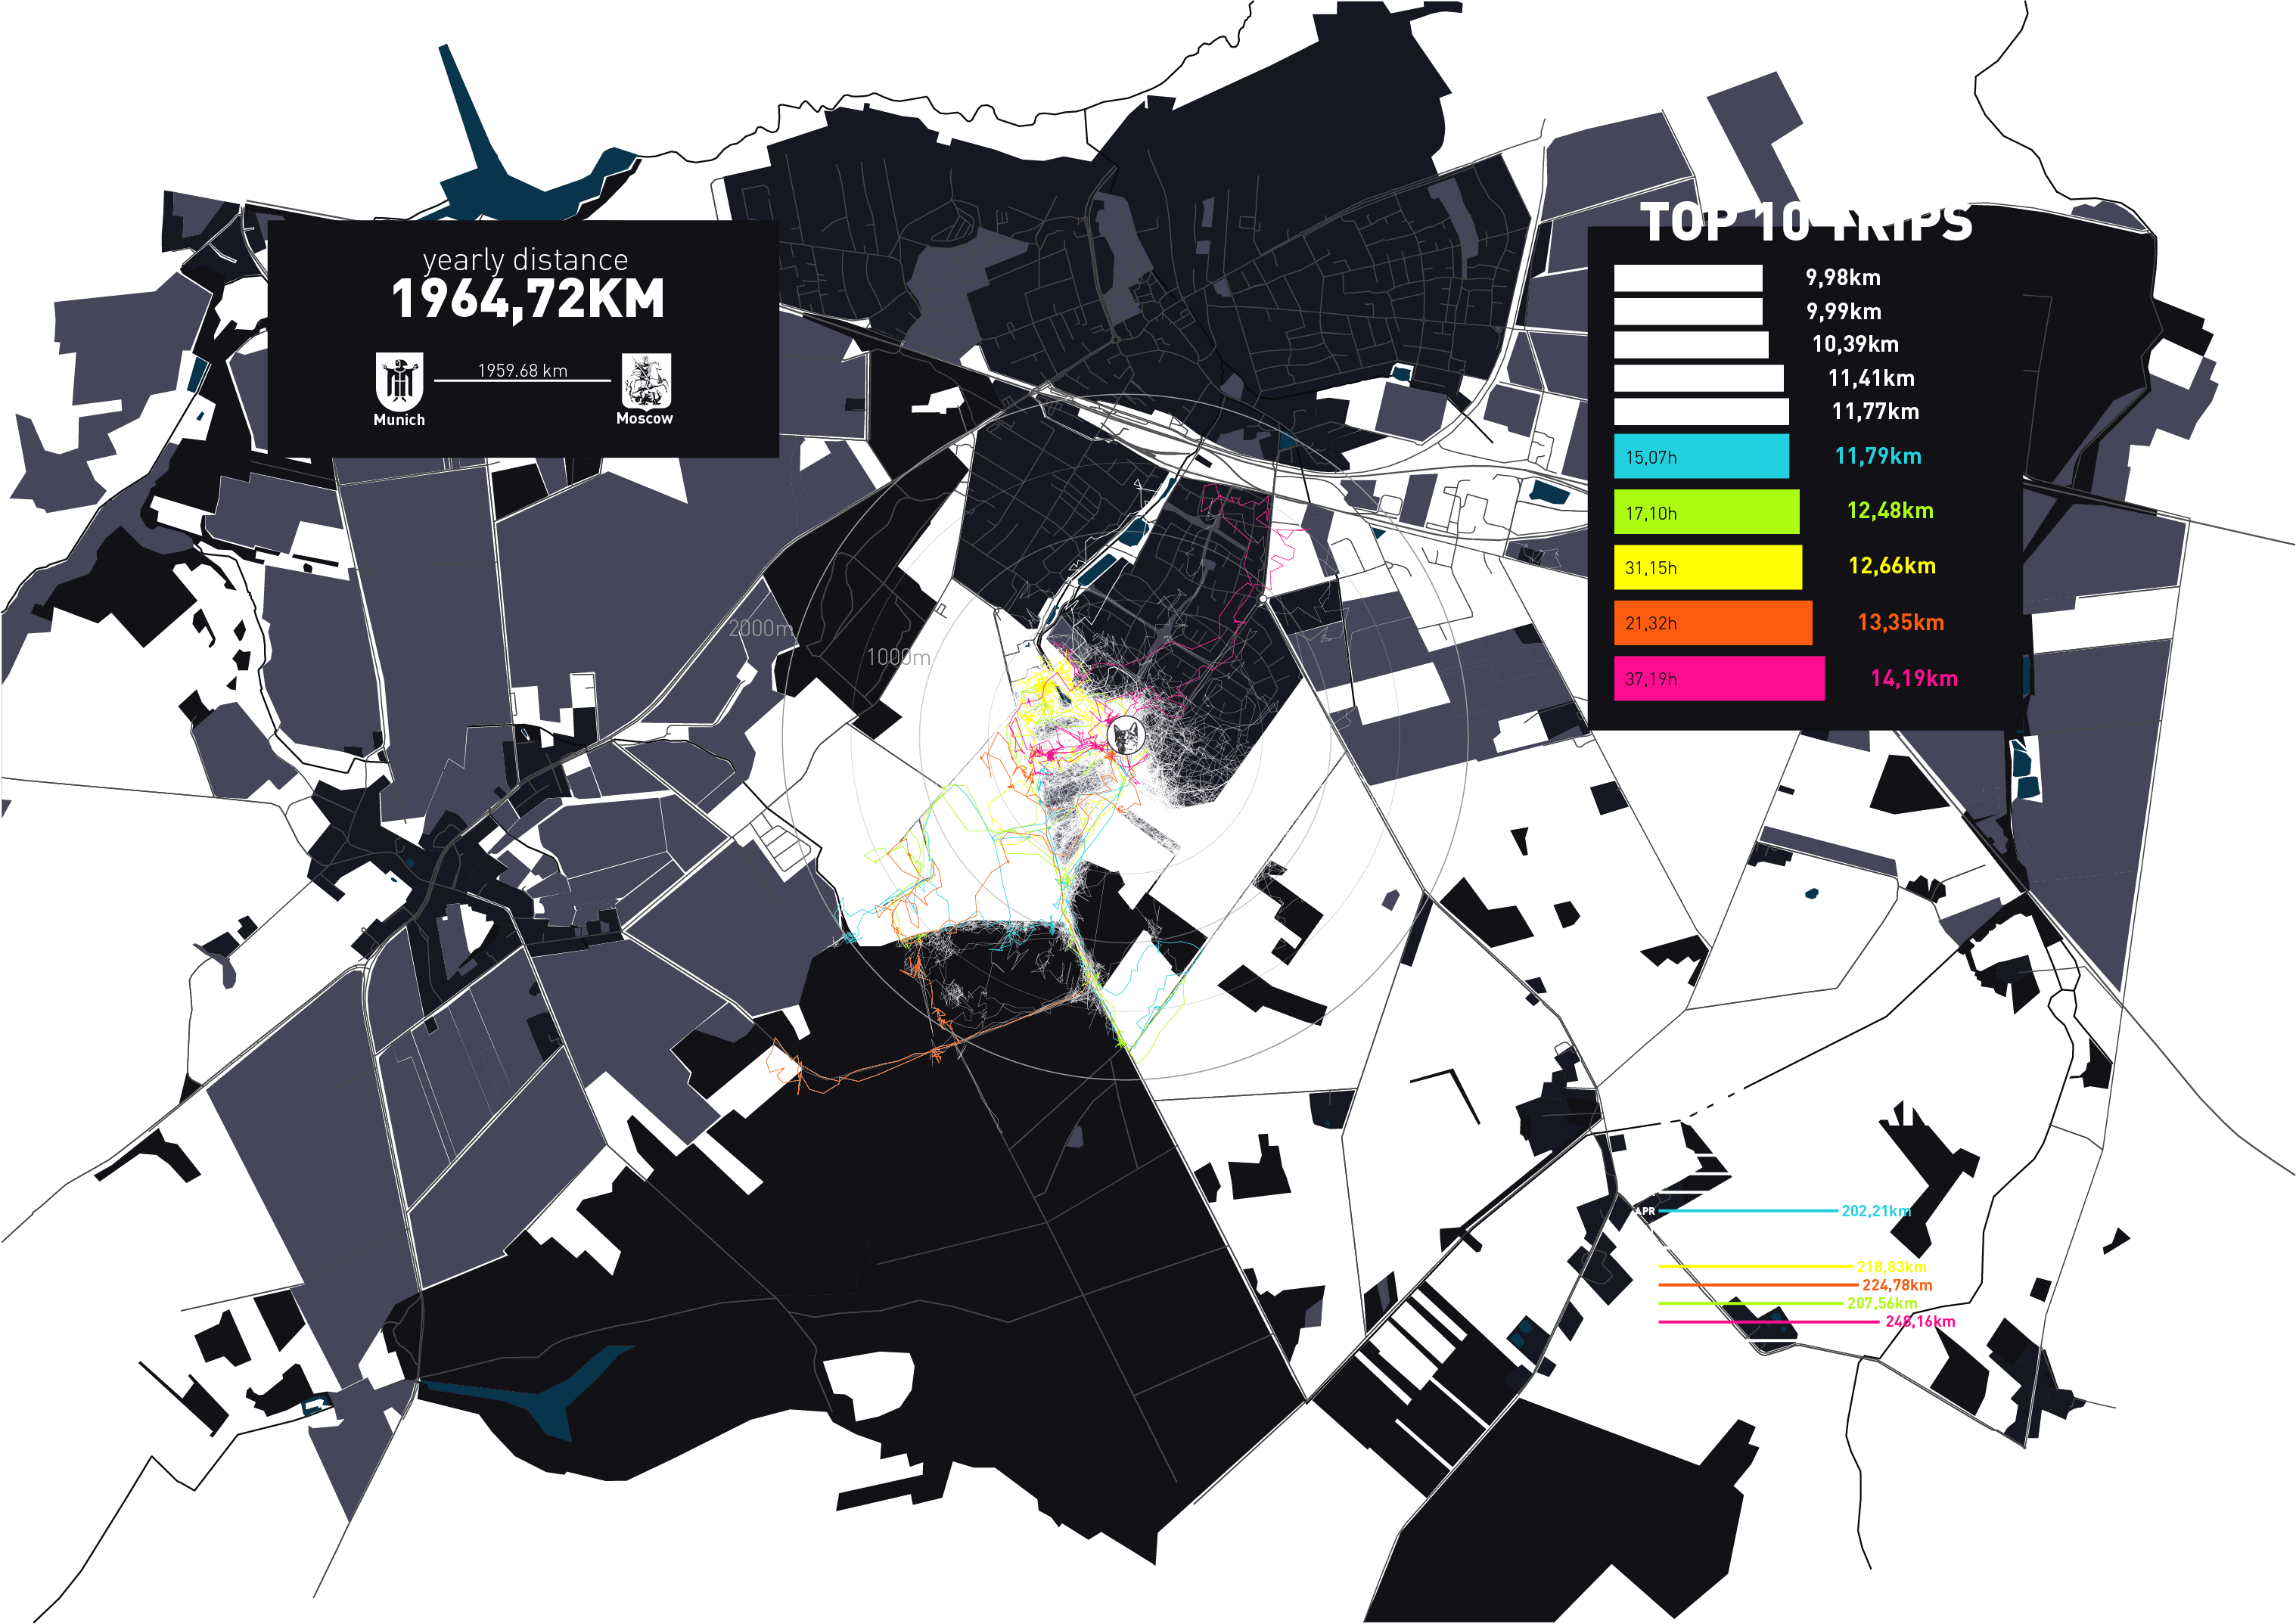
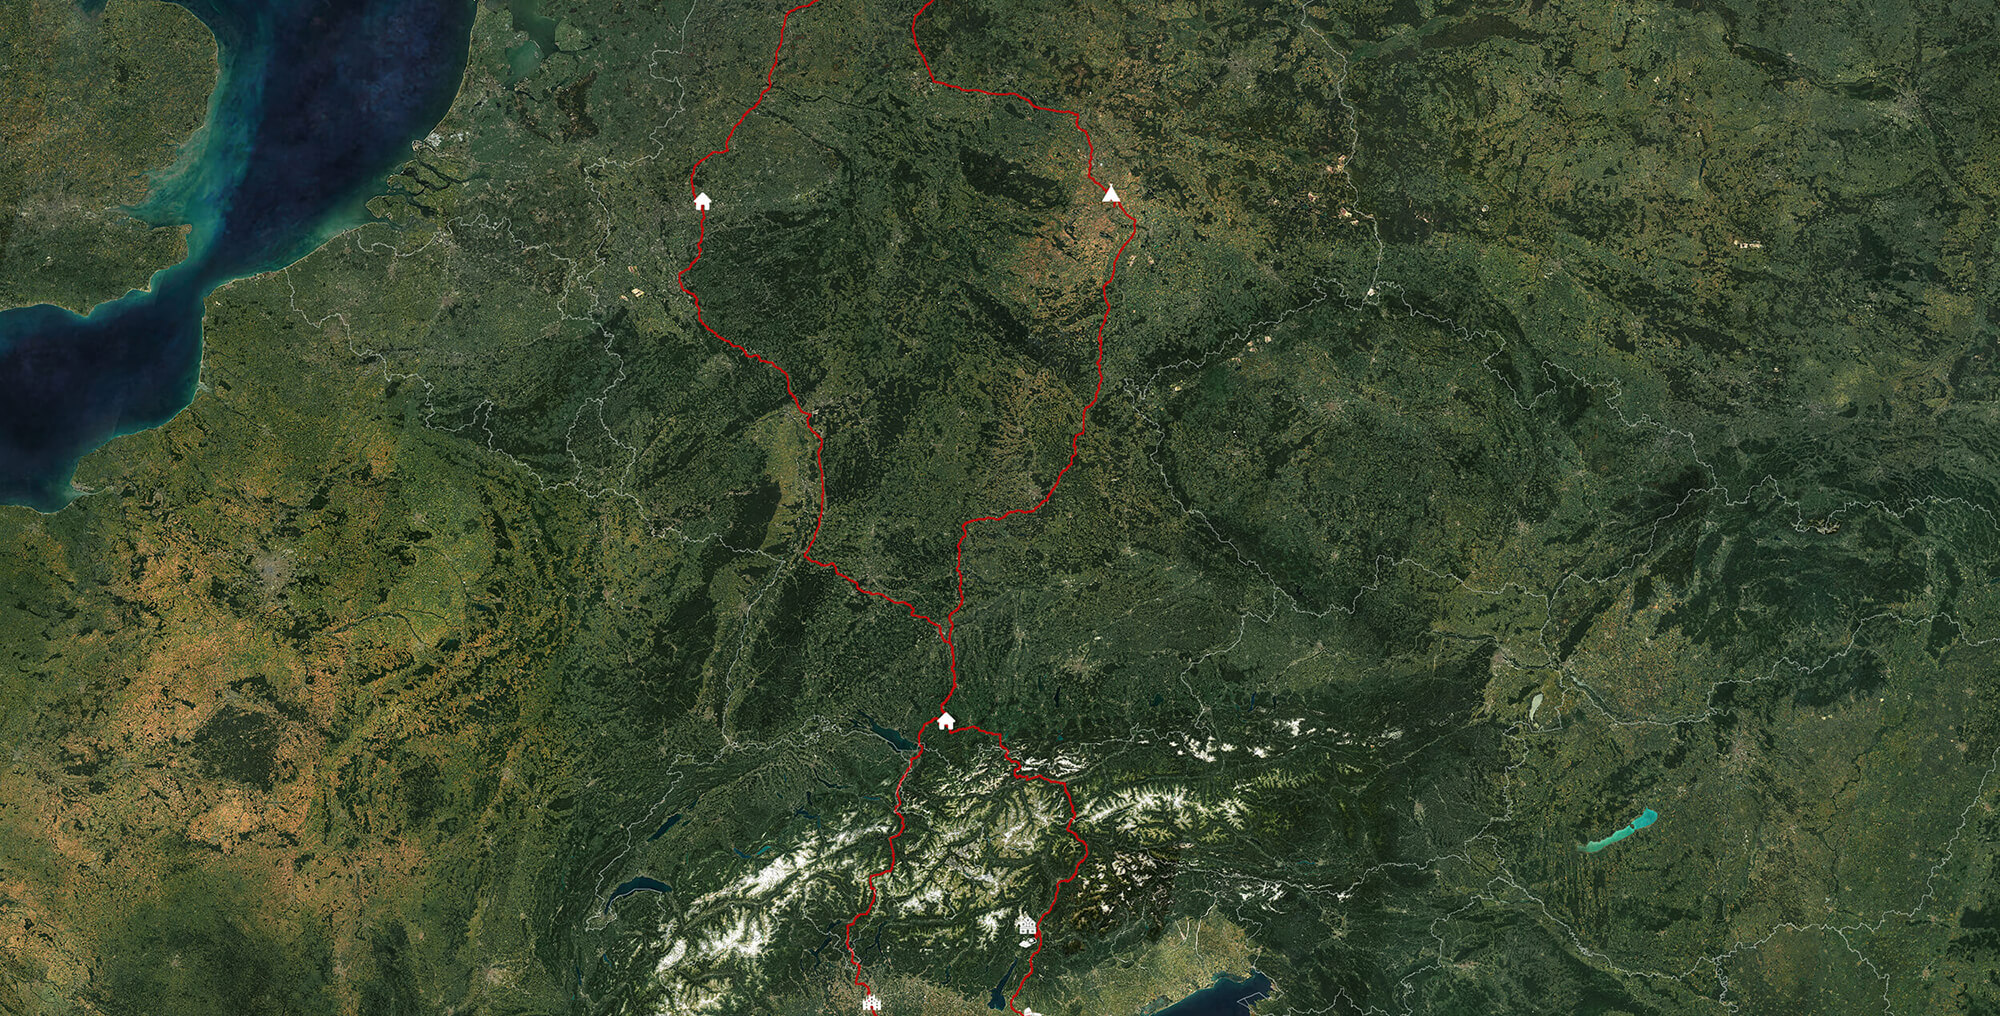
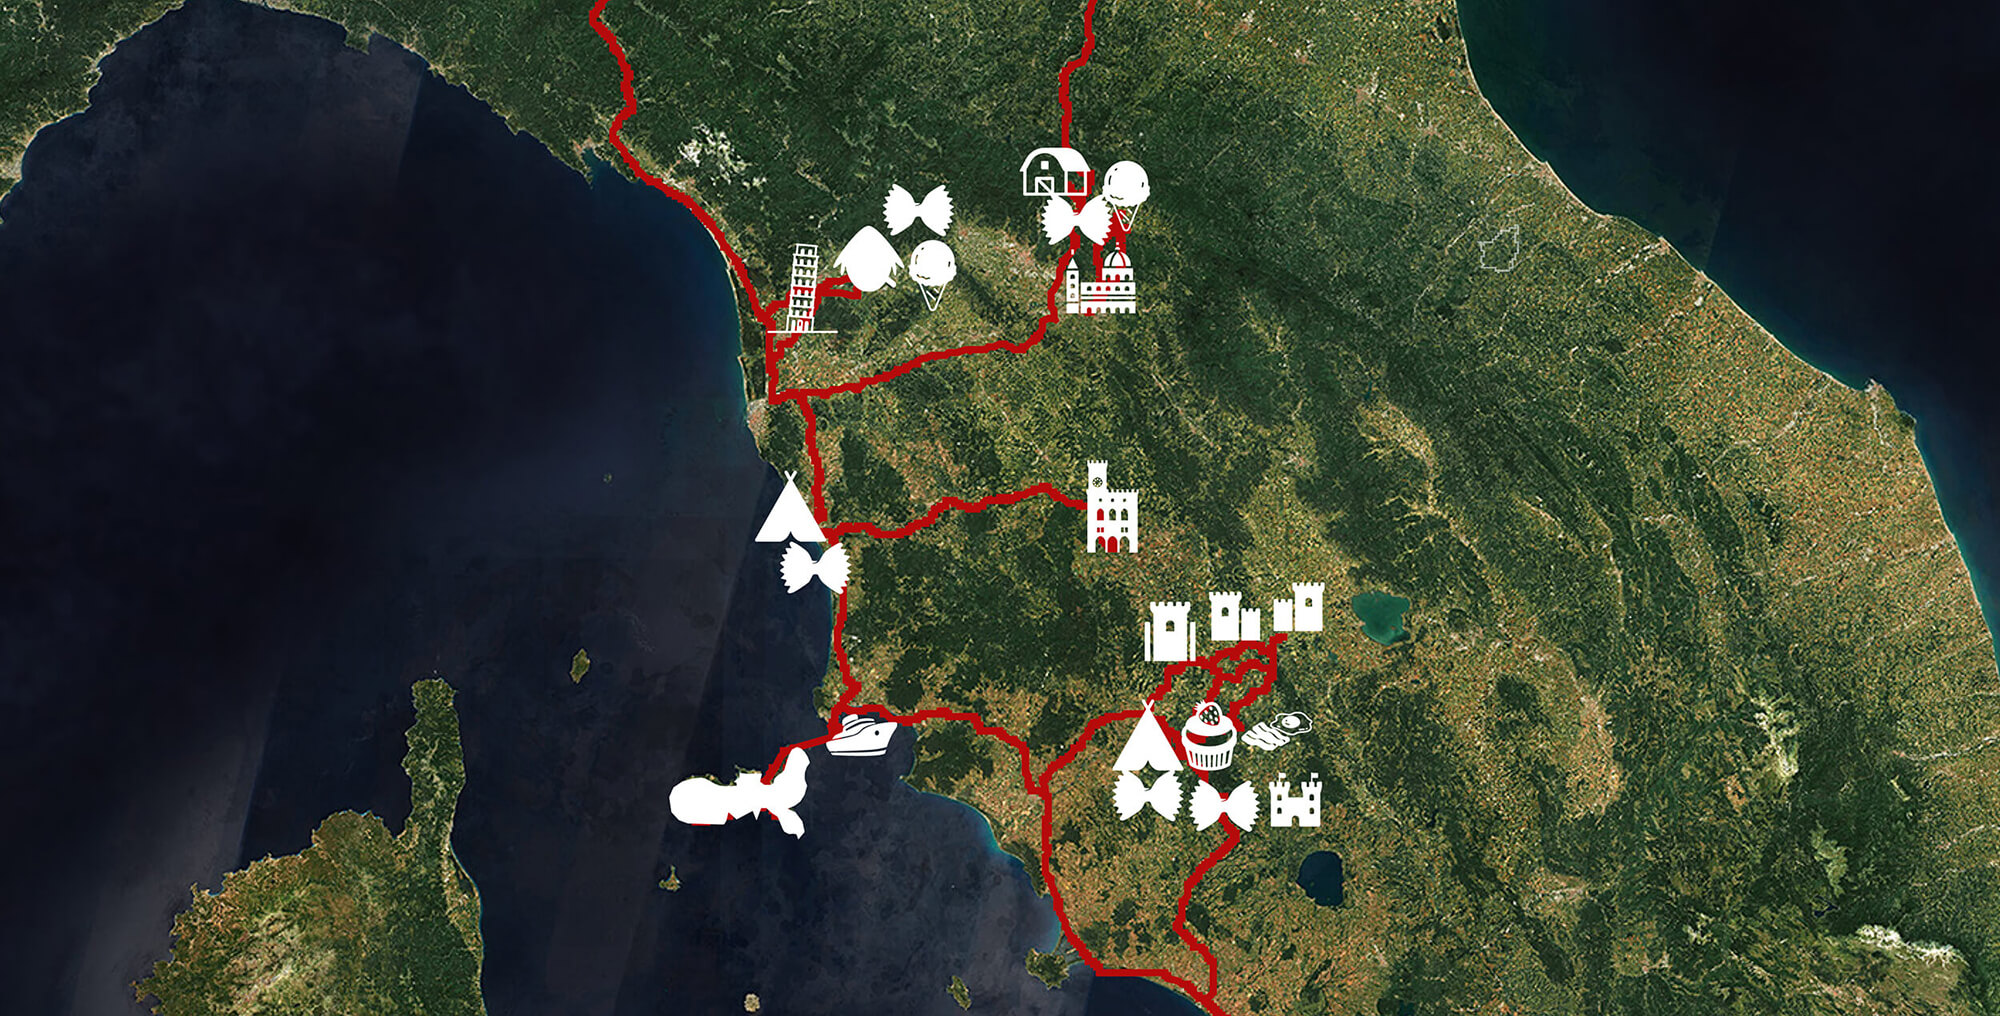
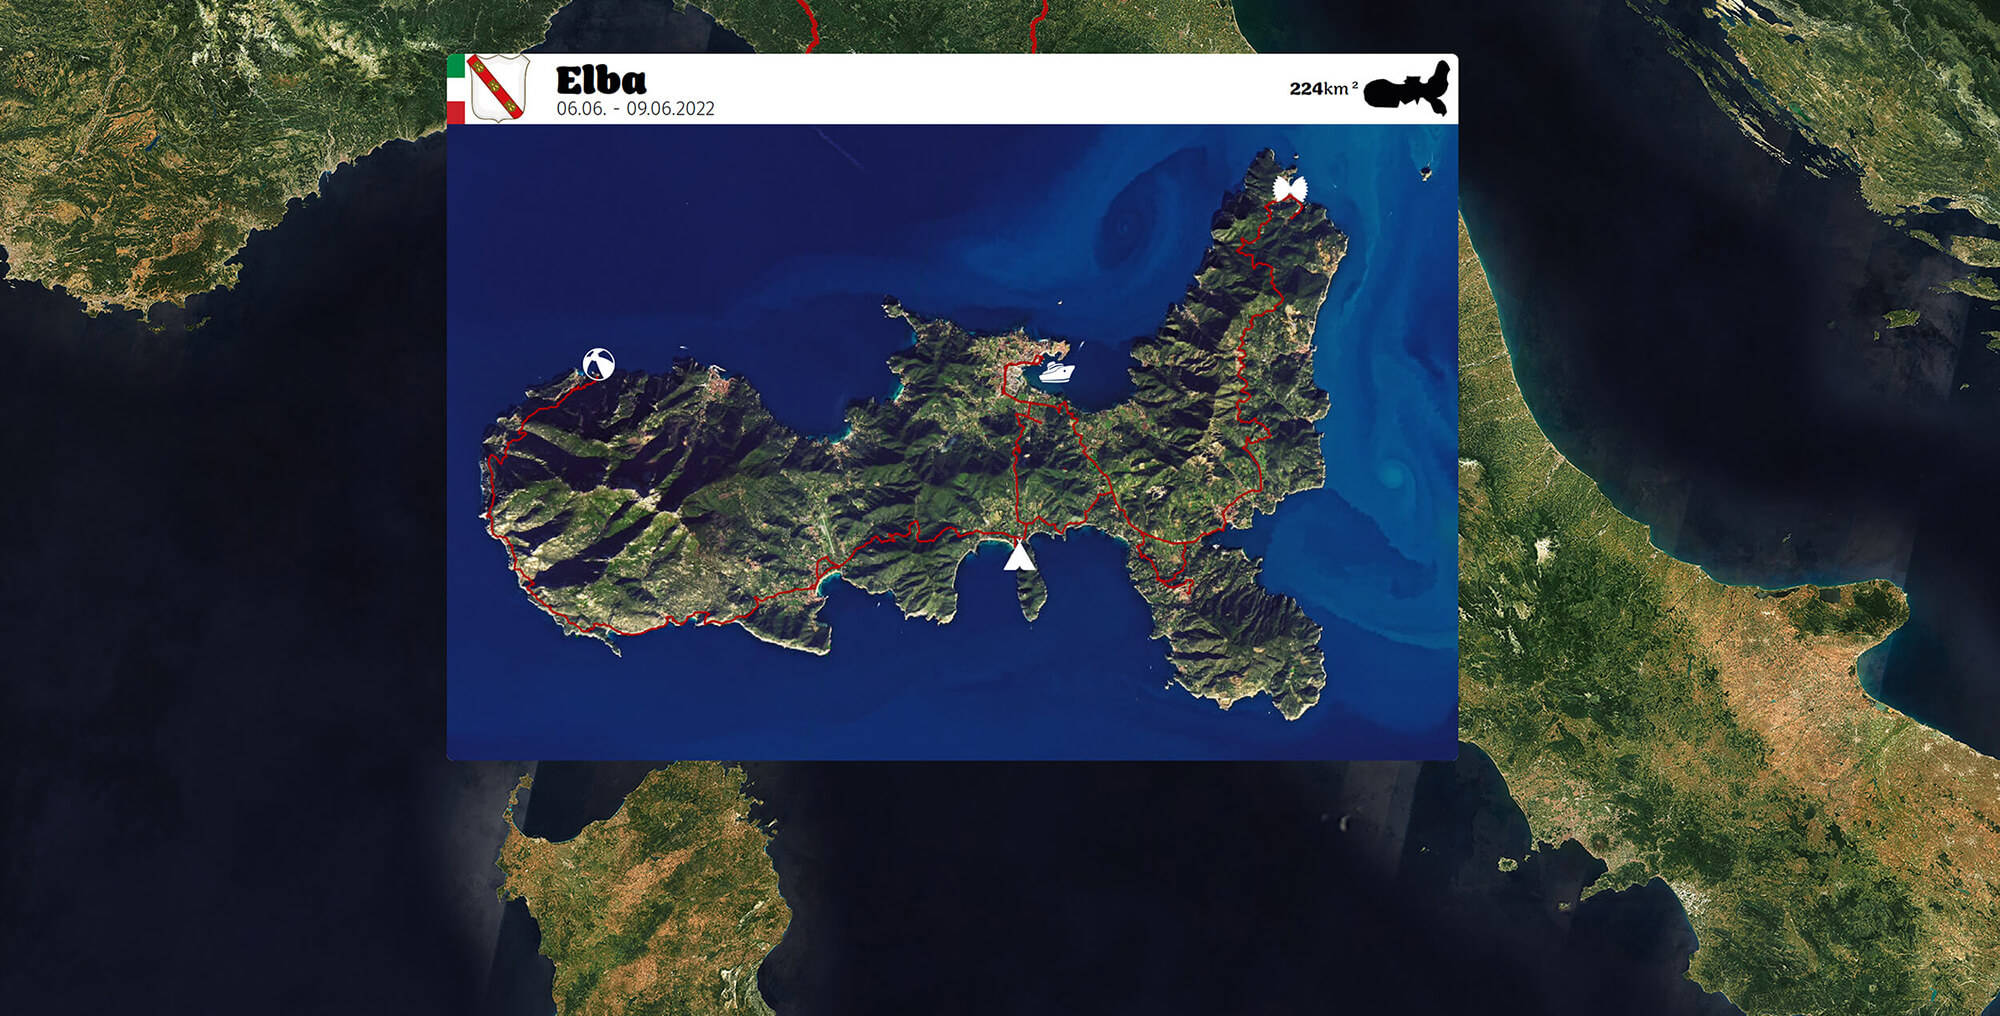
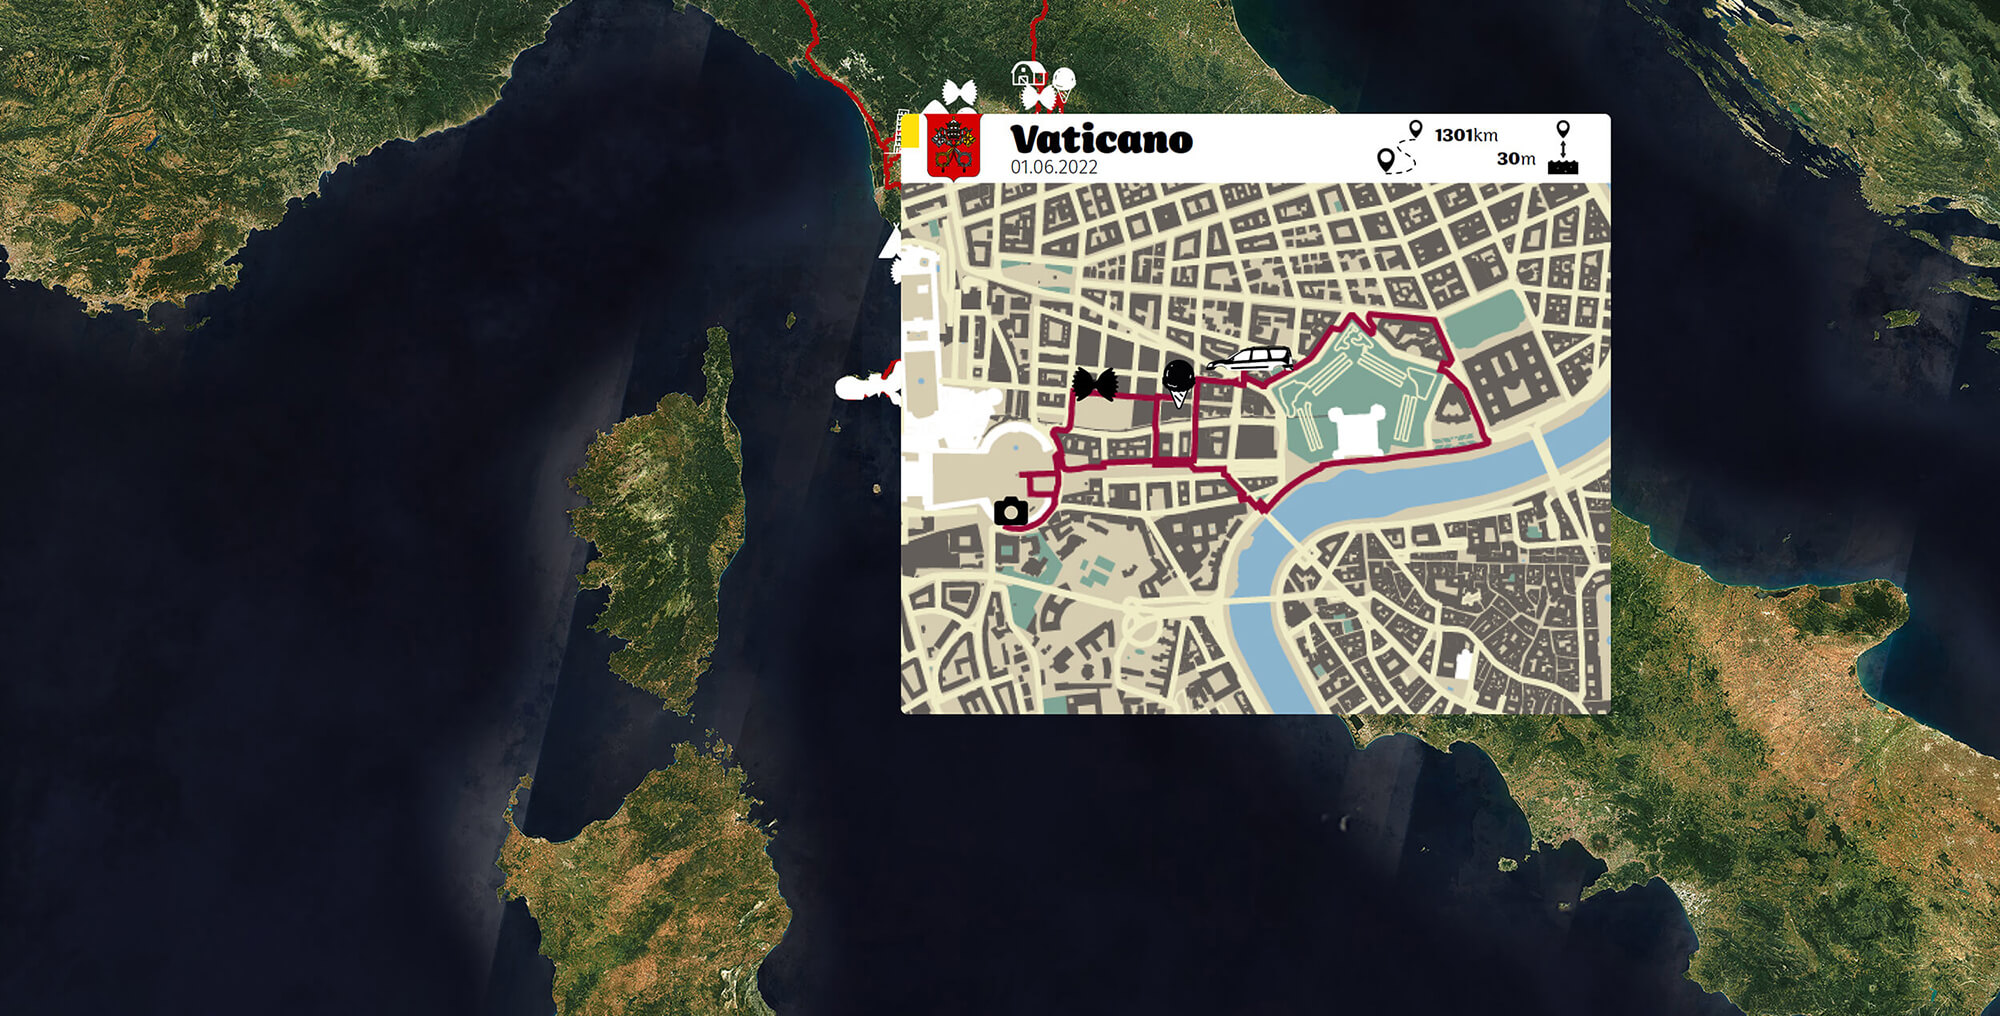
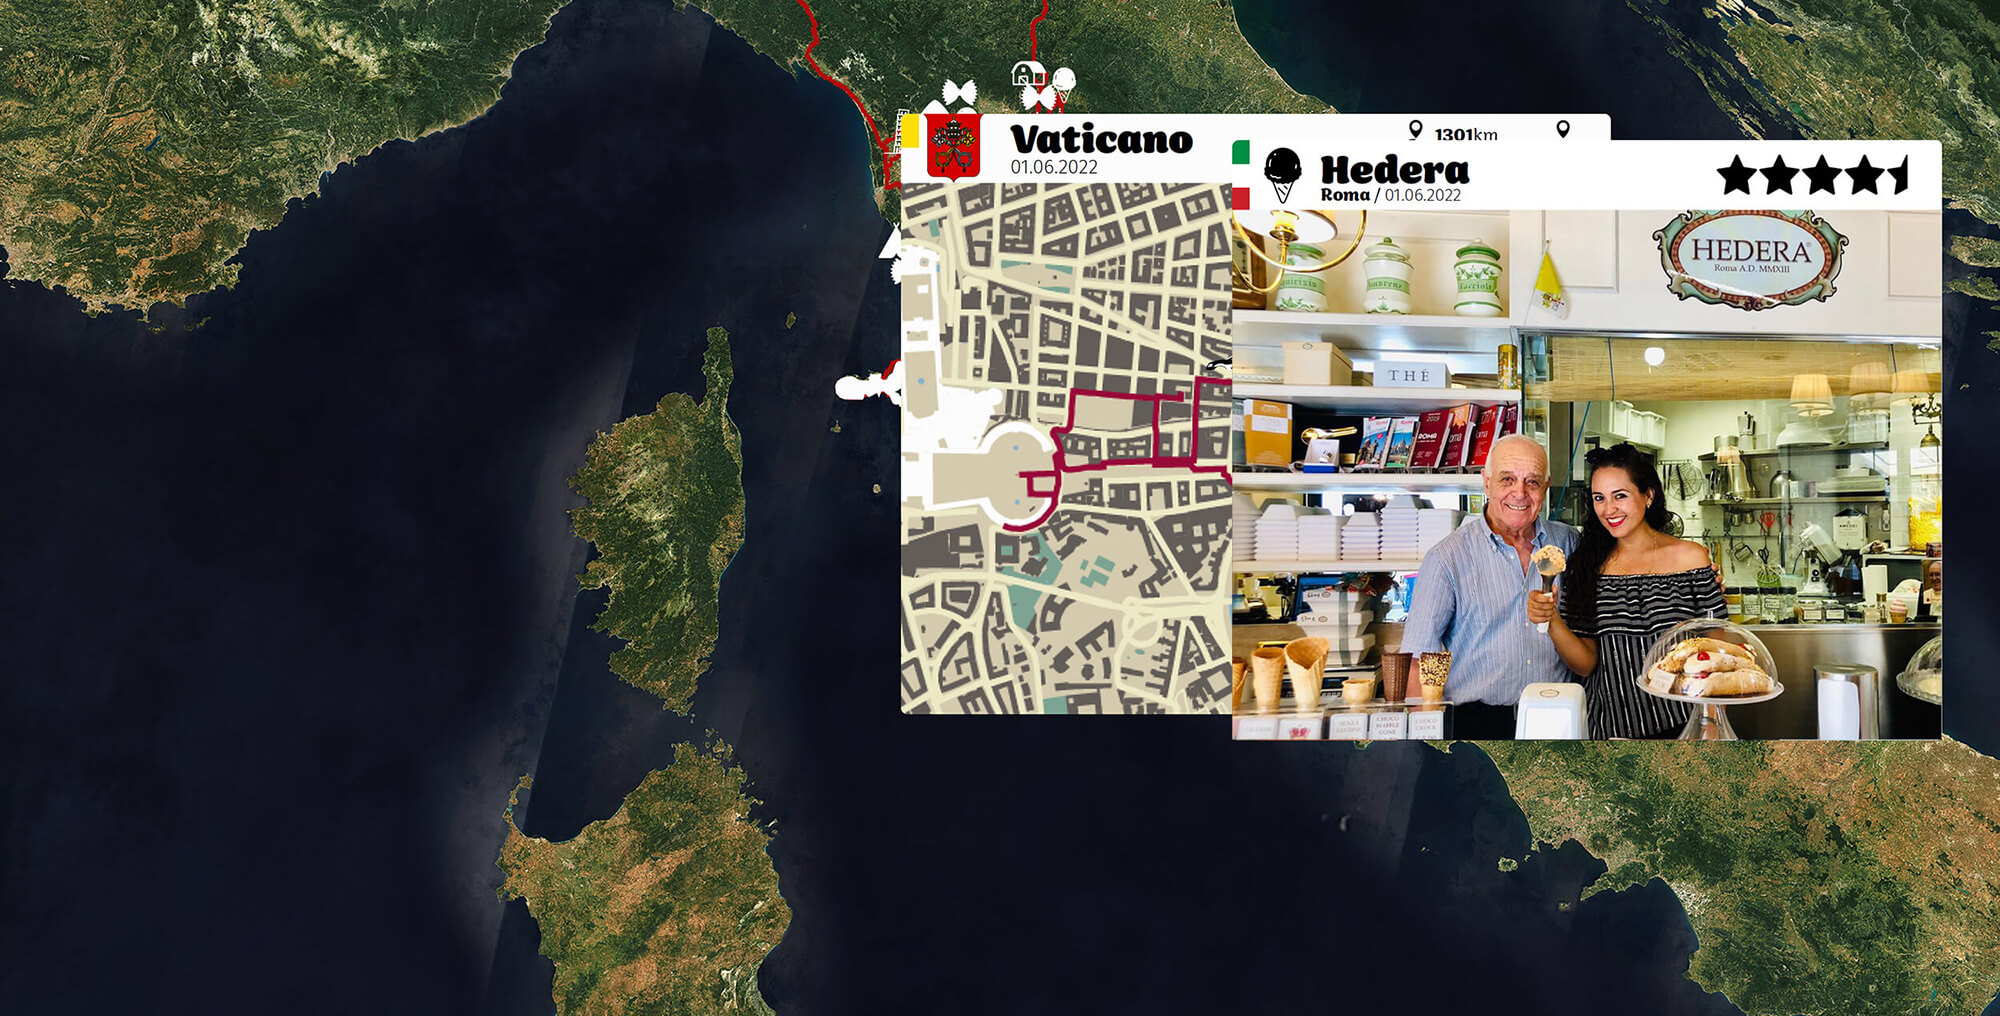
This is a project which replaced the classic photo album of a vacation trip through Europe by retracing the route in Google Maps, importing those into QGIS and reworking the exports in Adobe Illustrator. It was ultimately created as an interactive PDF in Adobe InDesign. Icons were created in Adobe Illustrator and satellite imagery optimized in Adobe Photoshop. There are some performance issues due to the huge scale satellite imagery. For the screenshots the private photos were replaced with images of the restaurants.


